Visualizing AMQP Broker Behavior with Clojure and Incanter

I’m working with our system architect (Mark Mehalik) evaluating AMQP as a messaging implementation for a new project. One of the things want to prove out is how the brokers behave under a widely varying number messages, message sizes, numbers of producers, consumers, queues and in differing clustering configurations. Since AMQP is a standard we should be able to build a single test suite and then execute it against the different brokers to measure their behavior as well as how robust they are under those conditions.
Scripting and Automation
I started the process of mocking up and automating the tests with the goal to help us figure out what we want to test. I chose to do this with Clojure and to use Incanter for a quick and easy visualization. You can the check the code out of my sandbox project on GitHub. The example code exercises a local AMQP v0.8 broker using the RabbitMQ Java Client Libraries (which support 0.8 at this time).
Producer
To test the broker, I created a simple producer and consumer and had them pass small (371 byte) messages. They use the simple Rabbit Java client library primitives for Channel.basicPublish and Channel.basicGet. The message consists of an array of two values: a message id (integer); and a time-stamp (java.util.Date). They get serialized and placed into the AMQP message body. The producer just loops pushing all the messages to the broker and then logs its start and end times:
(defn producer [producer-num cnt]
  (rabbit/with-amqp
   {}
   (let [start-time now]
     (dotimes [ii cnt]
       (object-publish [ii (Date.)]))
     (log-producer-stat producer-num cnt start-time (now)))))
Consumer
The consumer is a bit more more complex, doing more book keeping. It tracks the number of messages it receives, its own elapsed time and totals up the amount of time each message was spent on the queue. Just as with the producer, it logs its timings after it has consumed all of the messages on the queue.
(defn consumer [consumer-num]
  (rabbit/with-amqp
   {}
   (let [start-time (now -1)
         num-msgs   (atom 0)
         msg-age    (atom 0)]
     (loop [[ii dt] (rabbit/object-get)]
       (if ii
         (let [end         (now -1)
               msg-elapsed (- end (.getTime dt))]
           (reset! num-msgs (+ 1 @num-msgs))
           (reset! msg-age  (+ msg-elapsed @msg-age))
           (recur (rabbit/object-get)))))
     (log-consumer-stat consumer-num @num-msgs start-time (now) @msg-age)
     (let [elapsed (/ (- (now) start-time) 1000.0)
           rate    (/ @num-msgs elapsed)]
       (prn (format "%s messages in %s elapsed seconds @ %s/second"
                    @num-msgs
                    elapsed
                    rate))))))
Benchmark
I chose to run a series of tests with message counts from 1 up to 500k, repeating each test three times. This is only to get some data to play with, we plan on creating longer running and distributed tests over the next week to measure the behavior of the brokers in other configurations. This test was enough to produce data for me to try out Incanter with though and given how easy this was to create, we’ll likely continue to modify this set of files.
(defn run-benchmark [broker num-prods num-cons]
  (doseq [msg-count [1 5 10 50 100 500 1000 5000 10000 50000 100000 500000]]
    (run-single-benchmark (format "Series-%sm-%sp-%sc" msg-count num-prods num-cons)
                          broker
                          3
                          msg-count
                          num-prods))
  (prn (format "run-benchmark: %s completed" broker)))

(defn run-single-benchmark [series broker num-runs num-msgs num-producers]
  (dotimes [run-number num-runs]
    (binding [*testing-info* (merge *testing-info*
                                    {:series  series
                                     :broker  broker
                                     :run-num (+ 1 run-number)})]
      (let [msgs-per-producer (/ num-msgs num-producers)]
        (dotimes [ii num-producers]
          (.start (Thread. (fn [] (producer (format "p%s" ii) msgs-per-producer))))))
      (Thread/sleep 100)
      (consumer "c1"))))
Incanter Visualization
Once we had run this against Apache’s Qpid and RabbitMQ there was enough data to produce some charts. There is code to support loading the collected data from the files from disk, and the Incanter code is wonderfully easy to use.
get-stat-data pulls the data from the consumer log for the named broker as a sequence of maps where the column headers are the keys and the row fields are the values. get-xy-data pulls two of the fields and separates them into two sequences – just what the plotting functions in Incanter expect. simple-xy-plot then passes the two sequences to Incanter line-plot to visualize the data.
(defn get-xy-data [broker xname yname]
(let [stat-data (get-stat-data broker *consumer-stats-file*)
count-and-rate (map (fn [ent] [(ent xname) (ent yname)]) stat-data)
x-vals (map #(Double/parseDouble (% 0)) count-and-rate)
y-vals (map #(Double/parseDouble (% 1)) count-and-rate)]
[x-vals y-vals]))
(defn simple-xy-plot [broker xname yname]
(let [rabbit-data (get-xy-data broker xname yname)]
(line-plot (rabbit-data 0) (rabbit-data 1)
:title (format "%s vs %s" xname yname)
:x-label xname
:y-label yname)))
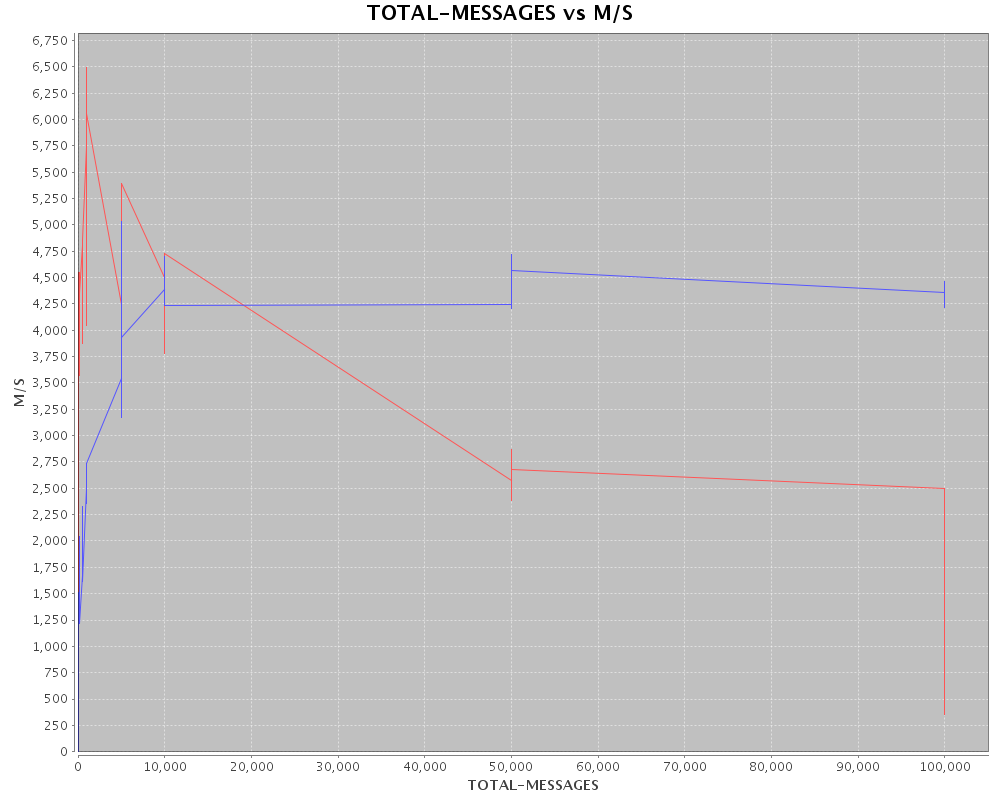
(view (simple-xy-plot "RabbitMQ" "TOTAL-MESSAGES" "M/S"))
(view (simple-xy-plot "Apache-Qpid" "TOTAL-MESSAGES" "M/S"))

I ran the broker, and a single JVM hosting both the producer and consumer on my workstation (along with all my other processes, X, KDE, Emacs and a ton of other processes). I did no tuning of the brokers, running them in their default configurations. I don’t expect these numbers to be too representative of the brokers performance in any kind of production configuration.
There are a few other interesting findings: With no tuning Qpid failed at 100k messages with an out of memory exception (crashed hard). This was with the default 1024Mb heap setting, at 2048Mb it was able to handle 100k messages and the graph shows Qpid using the 2048Mb heap setting. Rabbit survived up to 500k message (as far as I pushed it), but the performance degraded significantly down to about 170 messages per second.
Qpid RSS
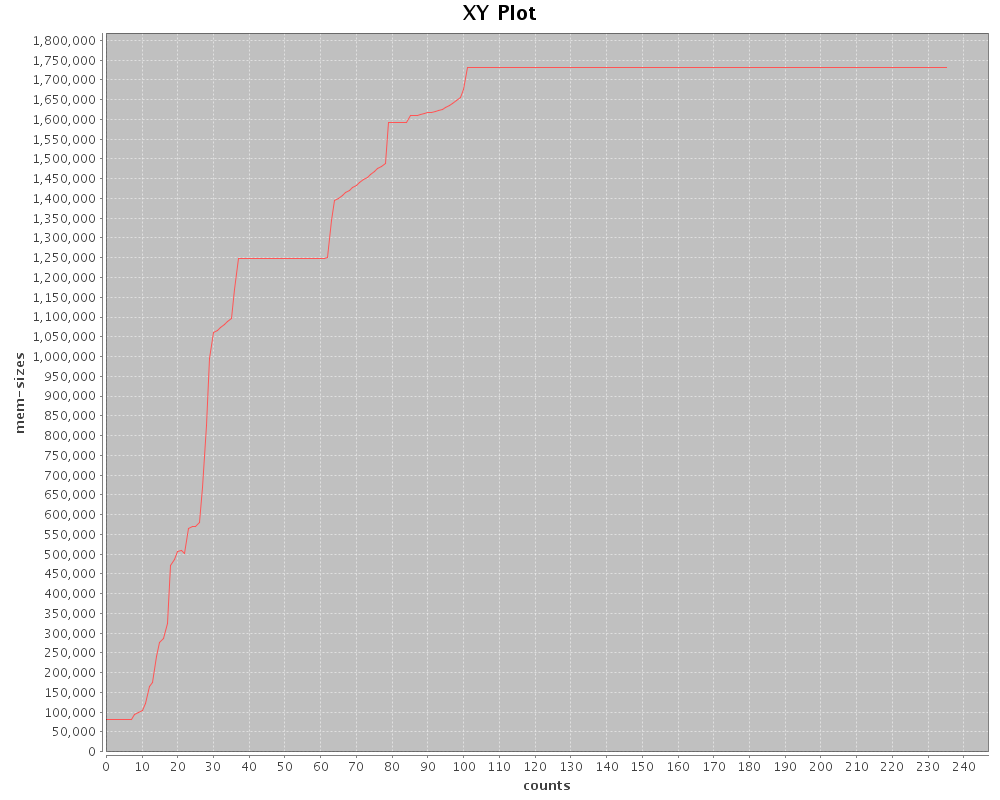
This shows the 2048M heap configuration growing up to the 100k message mark.
Qpid VSS
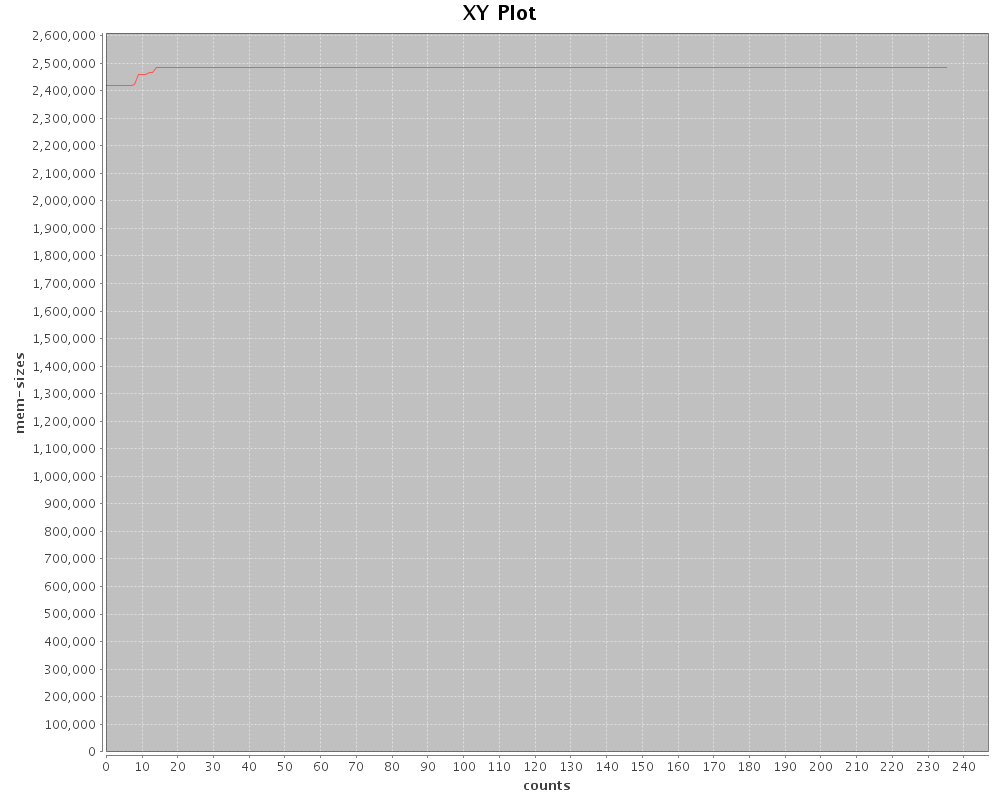
The flatness of this isn’t surprising as the JVM allocated its entire heap all at once.
Rabbit RSS
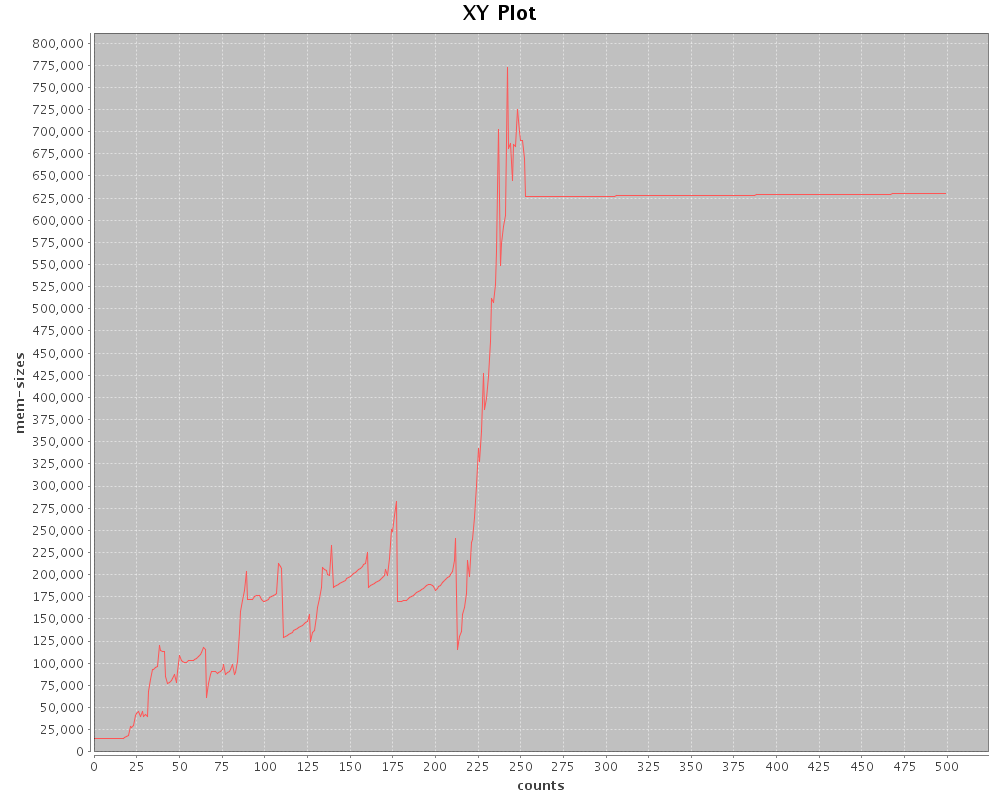
Erlang’s a bit more interesting, you can see it trying to cope with the various message loads, spiking up to about 3/4 of a gig with 500k messages. In this configuration Rabbit’s rate dropped significantly from its average, to about 170/s. It did stay up though. The next step here is to see what we can learn about how Rabbit is handling this deluge of messages.
Rabbit VSS
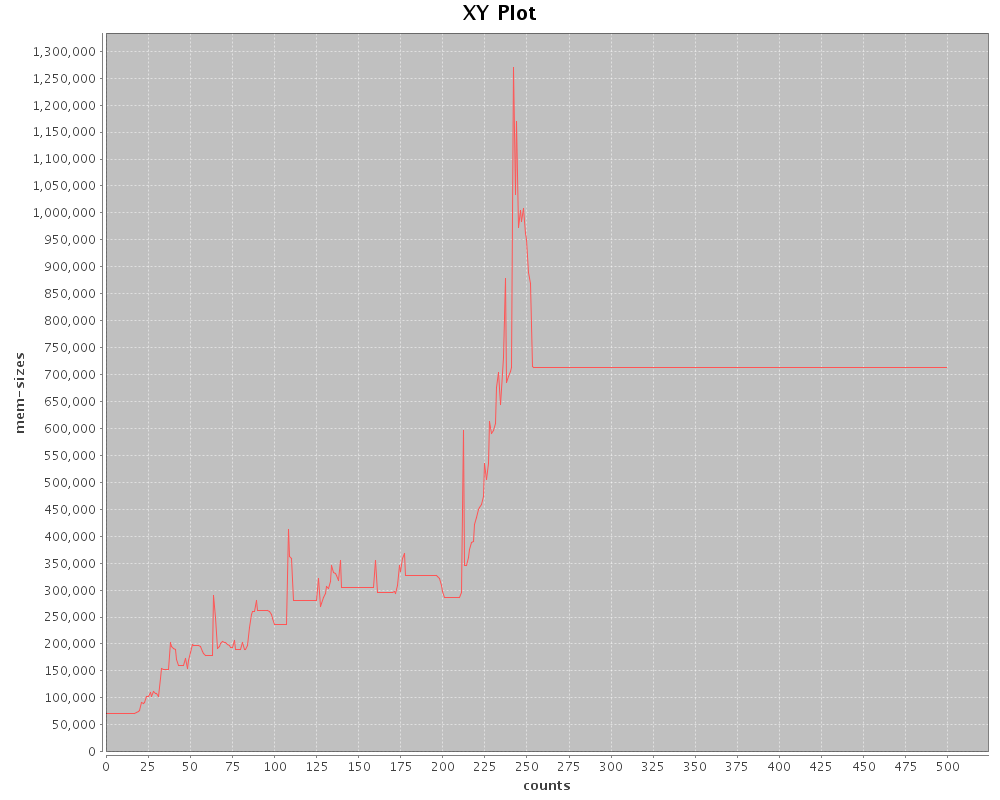
This pretty closely follows the shape of the RSS graph.
Rabbit vs Qpid Messages per Second
Clojure and Incanter
It was very straight forward to set up these benchmarks and the graphing code with Clojure and Incanter. We were able to try different approaches and visualizations very rapidly. Clojure’s ease of development and Incanter’s high level graphing functions turned the profiling from a chore into a fun task.